99 Problems With Building Your Own Embedded Dashboards
Building in-house embedded analytics often turns a simple "two-week" project into an endless maintenance trap involving complex auth, multi-tenant schema management, and UI glitches. MyReportPortal eliminates this engineering overhead by offering a turnkey, white-labeled solution that seamlessly handles the infrastructure and security for Sigma embeds.
Adam Roderick
If you’ve ever worked with embedded client-facing analytics, consider this your group therapy.
We've built hundreds of embedded dashboards and analytics portals. Somewhere around number fifty, we stopped fixing these problems and started collecting them, the way other people collect stamps. MyReportPortal is what happens when you get tired of fixing the same 99 things.
It always starts the same way. You have the dashboards. You have the data. You just need a portal to deliver them to your customers. "Two weeks, tops."
Then the "small project" becomes a monster. You wanted to ship features; you're shipping infrastructure. You wanted multi-tenant analytics; you got very, very familiar with iframes.
You wanted to build it and move on. Now the buggy thing won't leave you alone!
So yes, this post might be a sales pitch. Or, it's a sympathy card for every engineer who has stared at yet another "You don’t have permission to access this page" message from Sigma at 11 PM.
No single item below is impossible. We've fixed every one of them, most more than once, a few this week. The problem is that there are 99.
Auth and Access
Tokens can expire at the most inopportune times
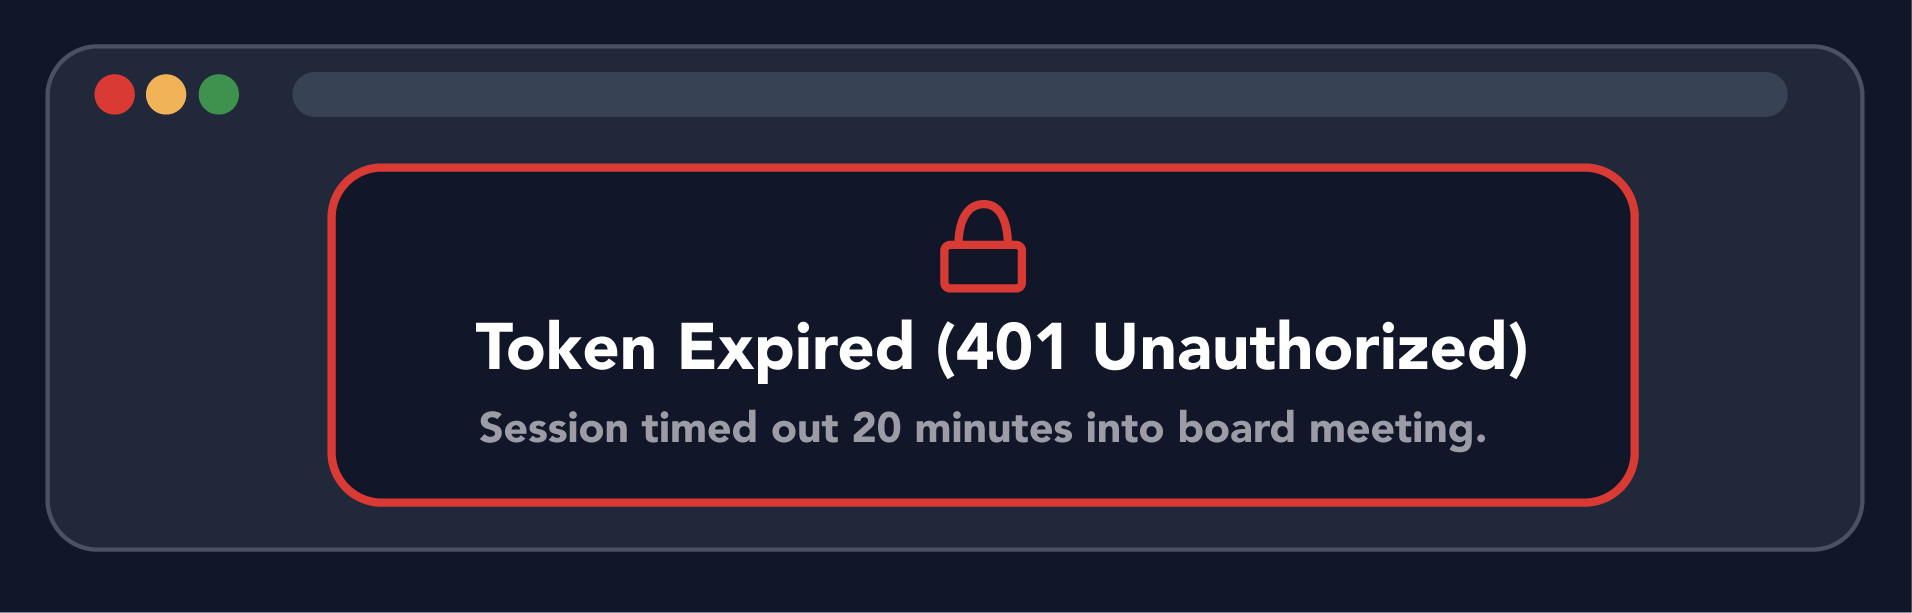
The embed token expires 20 minutes into a board meeting. Short-lived tokens are good security. They're also why the CFO's chart turns into a gray box mid-sentence while she's walking the board through Q3 performance. The solution: a refresh flow that renews quietly in the background, survives a laptop waking from sleep, handles two open tabs racing each other for a new token, and never interrupts anyone. Nobody scopes that work. Everybody discovers it lives in the one room where it hurts most. Ask us how we know.
The JWT signs fine locally and fails in production with the message "unauthorized." That's the whole message.
Silent re-auth loops that also log the user out of your main app.
Nobody agrees whether user identity lives in your app, the BI tool, or the IdP.
An enterprise customer asks for SCIM provisioning. You google SCIM.
Provisioning a tenant is a 14-step runbook one person has read.
Deprovisioning is a 14-step runbook nobody has read.
A user changes roles and keeps seeing their old data for six weeks.
Service accounts multiply until nobody knows which one runs production.
Key rotation is scheduled for "after the release." Which release is never specified.
Row-level security is enforced in three places and consistent in none.
You tested RLS with two tenants. You have 200.
The demo tenant is quietly full of real customer data.
Your incident response plan is a single Slack emoji. (We've upgraded to two.)
Multi-tenancy
The first 3 schemas looked good...
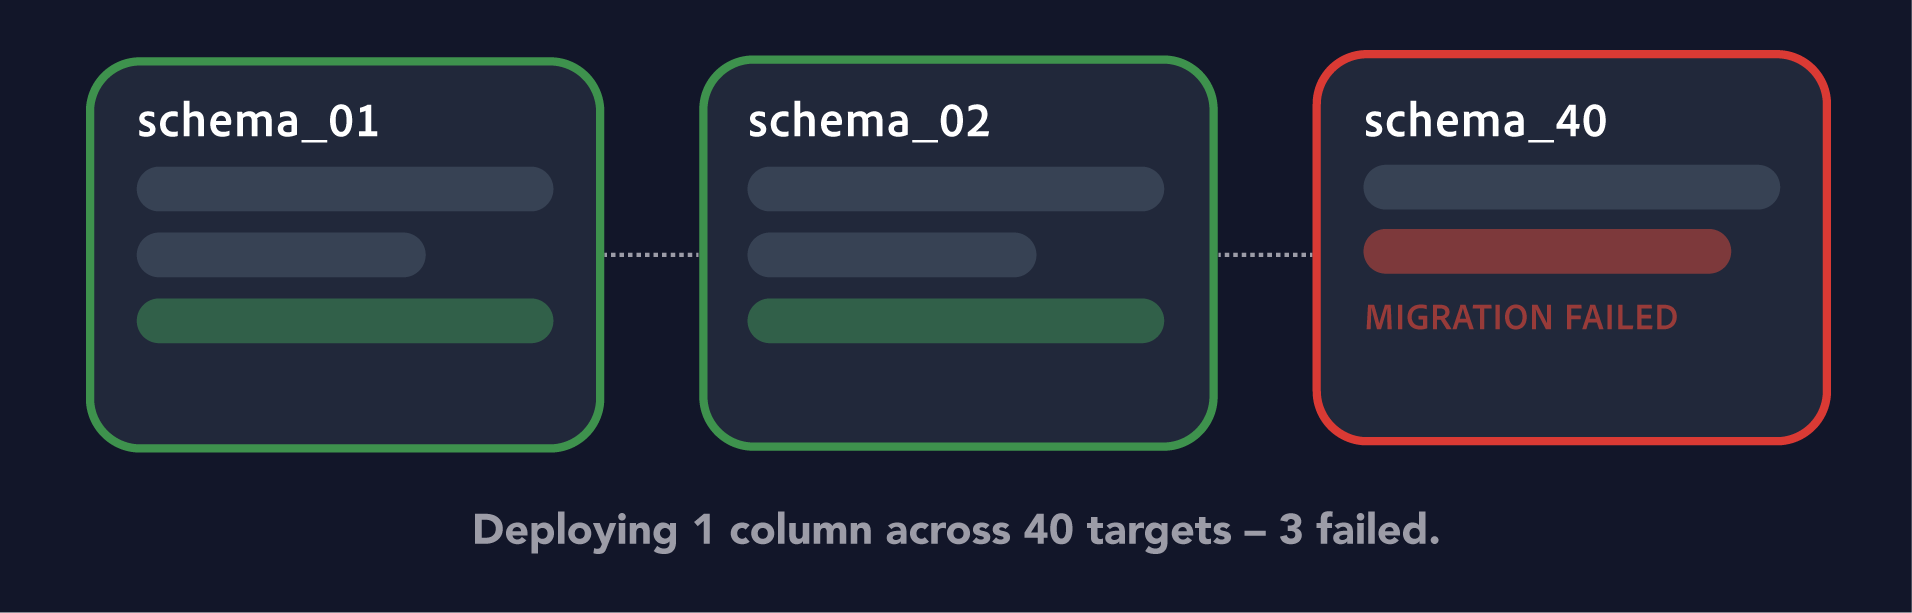
Separate schemas per client sounded clean until schema #40. Schema-per-tenant is a good isolation choice. It's the right call. But every schema is a full copy of everything: tables, views, migrations, permission grants. At five tenants it's tidy. At forty, a new column is deployed across forty targets, three of which fail for three different reasons, and one of which belongs to your biggest customer. The isolation that helped you sleep now keeps you up for new reasons. The answer isn't to abandon it. It's to automate it so thoroughly that schema forty is as boring as schema one. That automation is its own project. Budget for it.
One shared table with a tenant_id sounded clean until someone forgot a WHERE clause.
Adding a column means 200 migrations or one prayer.
A customer asks for "just one" custom field.
Thirty customers ask for "just one" custom field each.
Dashboards fork per tenant and drift apart.
You now maintain 12 versions of the same report.
Nobody can tell you which tenant is on which version.
A one-line bug fix becomes 12 pull requests.
"But v3 was better," says the customer.
Browser and Embed Mechanics
Russian doll of scrollbars is not a good look.
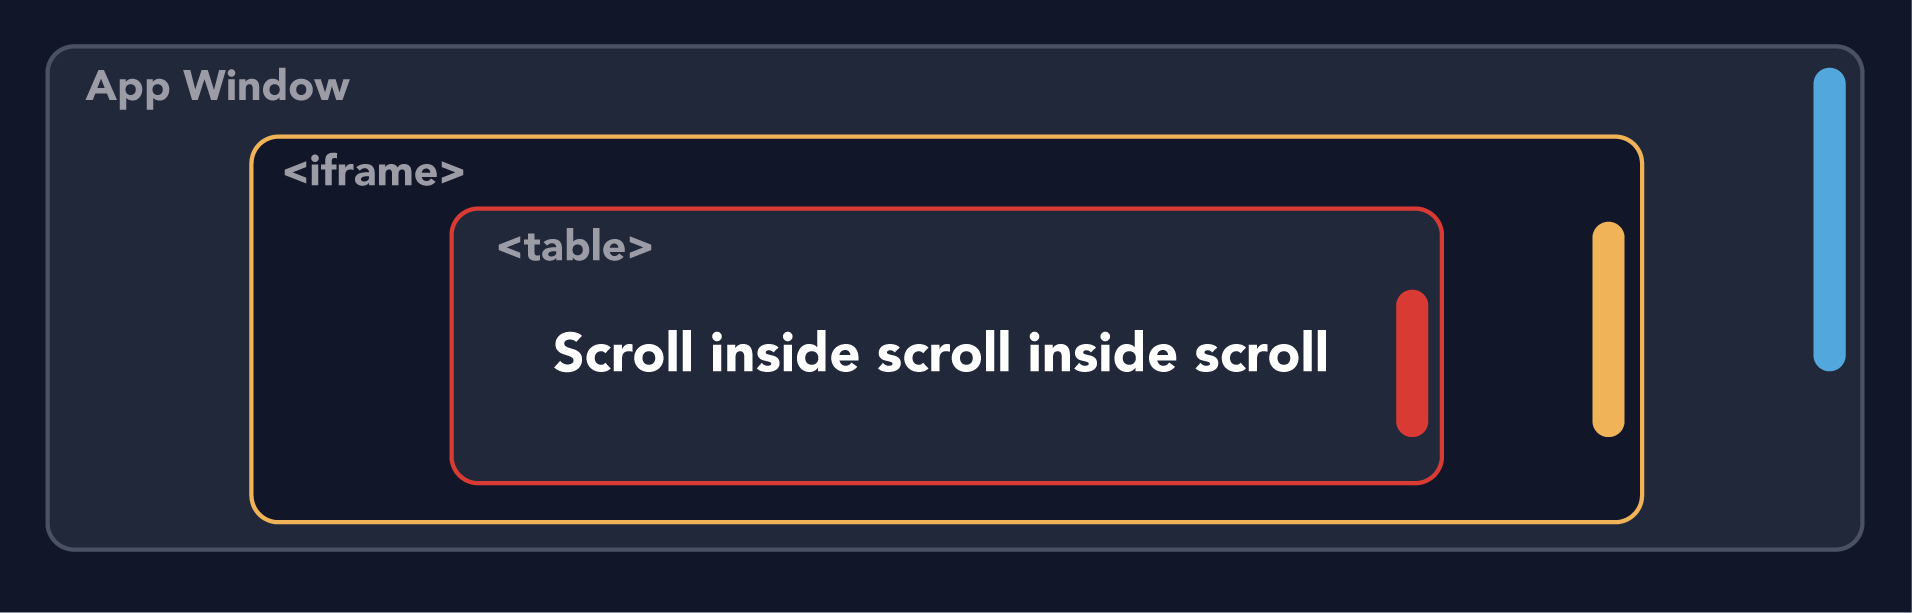
Scroll inside scroll inside scroll. The page has a scrollbar. The iframe has a scrollbar. The table inside the iframe has a scrollbar. The user flicks the trackpad and the wrong thing moves, then nothing moves, then everything moves at once. Fixing it means the iframe reporting its real height to the parent page, the parent resizing to match, and both agreeing on who owns scrolling, across every browser, zoom level, and screen size. It sounds cosmetic. It's the first thing every user touches, and it's what makes embedded analytics feel bolted on instead of built in. Nobody files a ticket that says "this feels cheap." They just stop logging in.
iframes: 1990s technology, load-bearing in your modern stack.
SameSite=None needs Secure needs a cert needs a DNS record needs a ticket.
A CSP header blocks the embed, and the only error is silence.
An ad blocker eats the dashboard on exactly one laptop. It's always the executive's.
The embed renders behind your nav bar.
Half your customer's users open the portal inside Microsoft Teams, which is its own browser with its own opinions.
The iOS webview inside your customer's field app is a black box.
The back button does nothing. Or everything.
Deep links don't preserve filter state.
Filter state is preserved, then shared with someone who shouldn't see it.
Print-to-PDF: the chart-cut-in-half special.
Dark mode was not in scope. It never is.
Resizing the window re-renders, which re-queries the warehouse.
Look and Feel
DNS settings aren't for the faint of heart
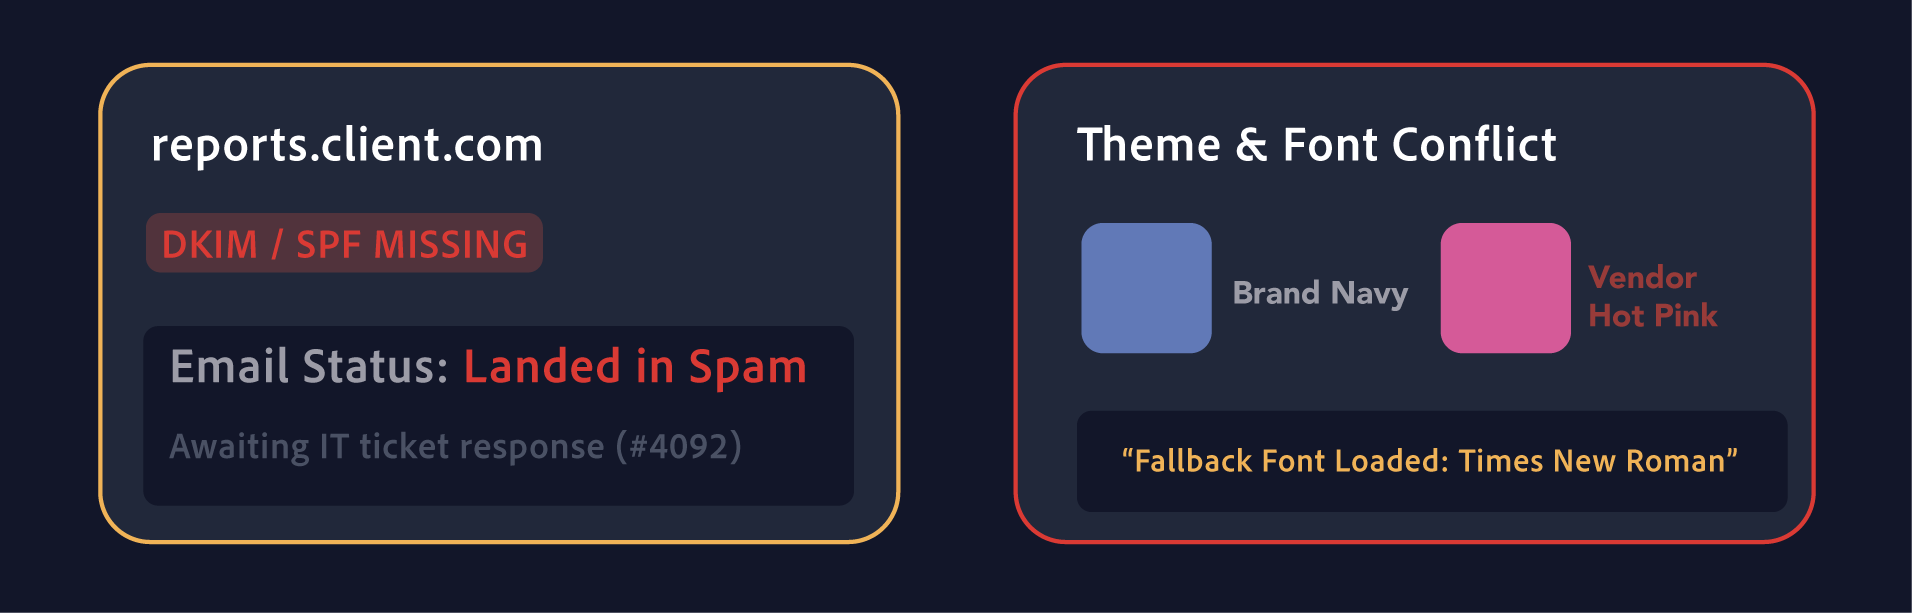
Custom domains, DNS, DKIM, and DMARC. Oh my! "Can it live at reports.ourcompany.com?" Sure. That's a DNS record your customer's IT team has to create, a certificate you have to issuemed and renew forever, and a support ticket every time either one lapses. Then the portal sends its first invite or scheduled report from the customer's domain, and it lands in spam, because sending mail as their domain requires SPF, DKIM, and DMARC set up correctly by an IT team that has never heard of you. Every white-labeled customer becomes a small DNS negotiation that moves at the speed of someone else's ticket queue. Multiply by your customer count.
White-labeling is perfect until the vendor's font loads.
Your brand color fights the default chart palette.
Your customer wants their brand color inside your product.
A vendor UI string appears in a language you don't ship.
The tooltip says "workbook." Your users say "report."
A vendor logo sits in the corner you promised to clear.
Design said pixel-perfect. The CSS said "close enough."
An accessibility audit arrives from procurement.
Screen reader support was also not in scope.
Speed and Spend
Performance issues can be hiding in plain site and mean failure for your portal
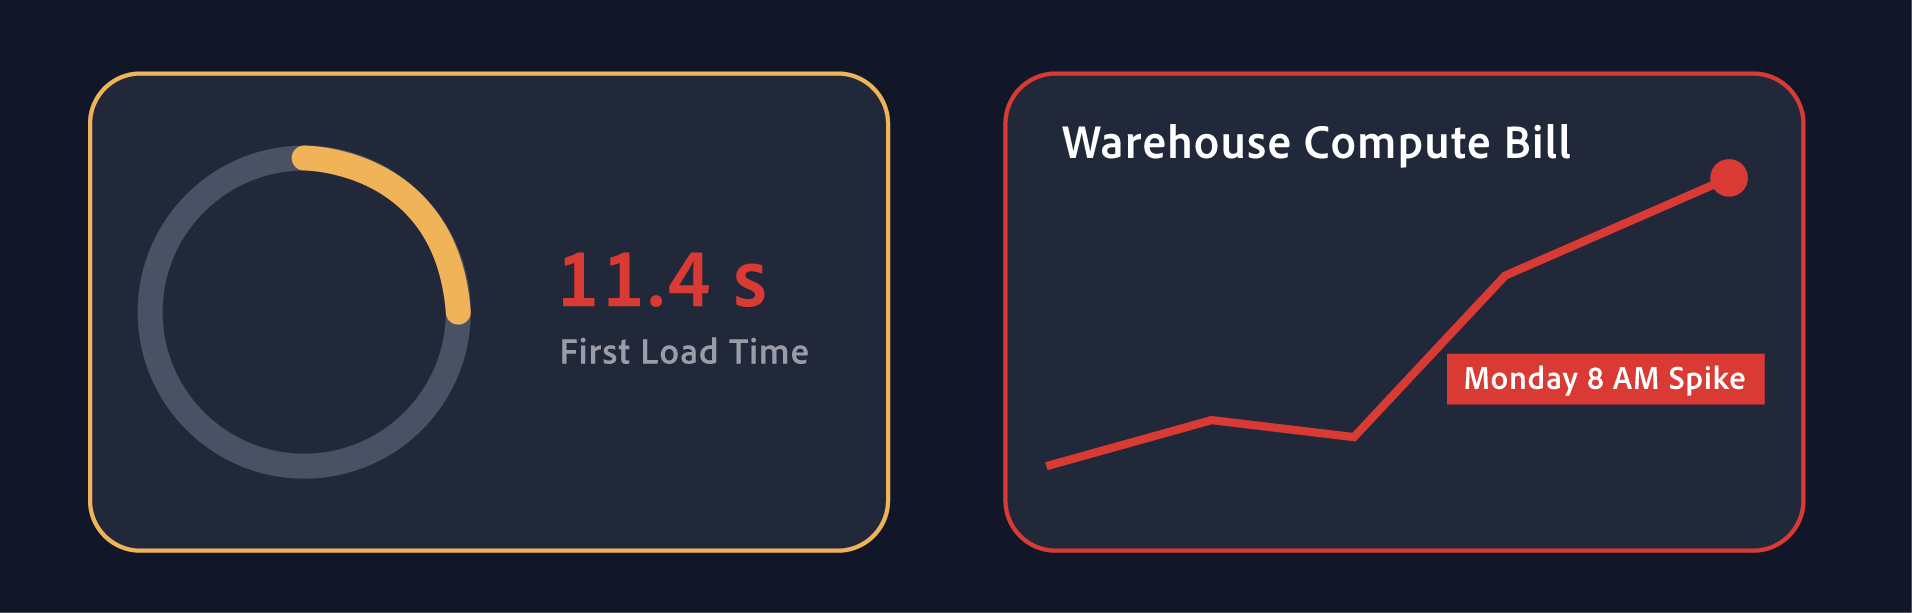
First load takes 11 seconds, the user never comes back. Those 11 seconds are your app authenticating, requesting an embed URL, signing a token, loading the iframe, loading the BI tool's JavaScript, authenticating again, waking the warehouse, and running every query on the page. Each step is reasonable. Together they make a spinner long enough to form an opinion, and users form it exactly once. If the first visit is slow, they decide the feature is slow and never come back to check whether you fixed it. Getting faster means working every link in that chain: prefetching tokens, keeping compute warm when it matters, loading the important charts first. None of that was in the original estimate.
Cold starts: your warehouse's morning coffee.
Everyone opens their dashboard at 8:00 AM Monday.
Concurrency limits, discovered at 8:01 AM Monday.
A cache serves yesterday's numbers to today's meeting.
Cache invalidation. Obviously.
The warehouse bill is a novel you never wanted to read.
Per-tenant cost attribution is its own dissertation.
One power user writes a query that scans the known universe.
Numbers and What They Mean
Formula Drift is real!
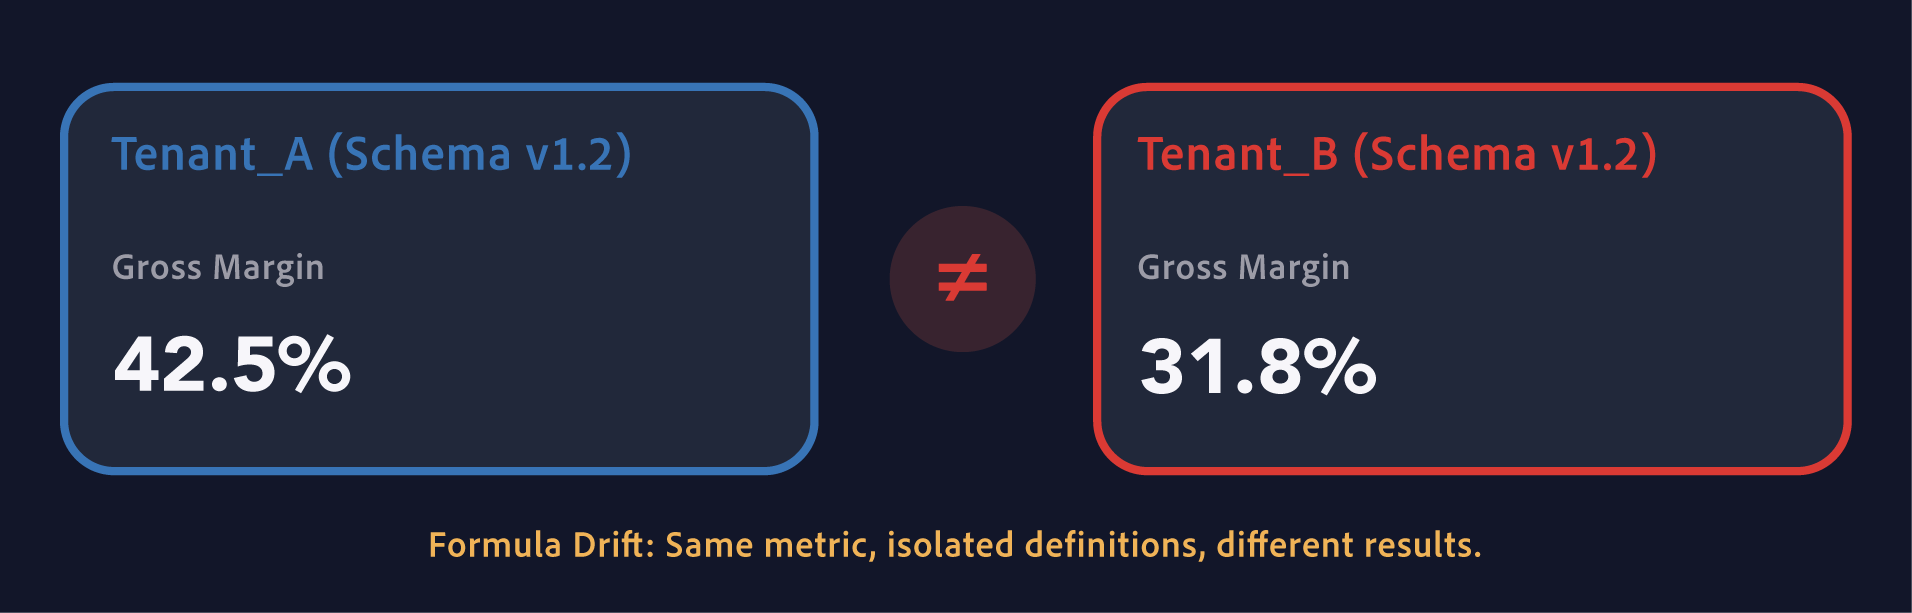
Formula drift; every tenant's schema has its own copy of the now fragmented metric. Separate schemas mean every tenant gets its own copy of the logic. A fix for one customer's edge case lands in their copy only. A hotfix goes to three tenants and never makes it back to the rest. Six months later, "gross margin" means eleven different things across forty customers, and nobody decided that. It just accumulated. Then two customers compare notes at a conference and ask why their numbers are calculated differently, and you don't have a good answer, because there isn't one. Isolated data is a feature. Isolated definitions are a liability. Metric logic has to live in one place and deploy everywhere, or drift is guaranteed.
Two departments, one metric name, two answers.
"Revenue" means booked to Sales, recognized to Finance, and "whatever the dashboard says" to everyone else.
The same KPI lives in five dashboards, defined five slightly different ways.
The source system upgrade renames three columns without telling you.
A field exists in the source and vanishes somewhere between there and the chart.
The dashboard doesn't match the spreadsheet, and the spreadsheet has seniority.
Reconciling numbers live, on a call, on speaker.
Nulls render as zeros, and zeros render as lies.
Rounding turns a total that ties into one that doesn't.
A historical restatement nobody mentioned until Monday.
Backfilling three years of data during business hours.
Building and Running It
But that first tenant looked perfect!
Testing 200 tenants? You're testing the one you built. Your test tenant has tidy data, default permissions, and the latest version of every dashboard. None of your customers do. One has a user with seventeen roles. One has a null in a column your chart assumes is always filled. One is still on the pre-redesign version because they asked nicely. The bugs live in those differences, and you find them when the customer does. Real coverage means testing against the variety you actually have: permission combinations, data shapes, version mixes. That's a test harness, which is software, which someone has to build and maintain. You may be noticing a theme.
Dashboards aren't in version control.
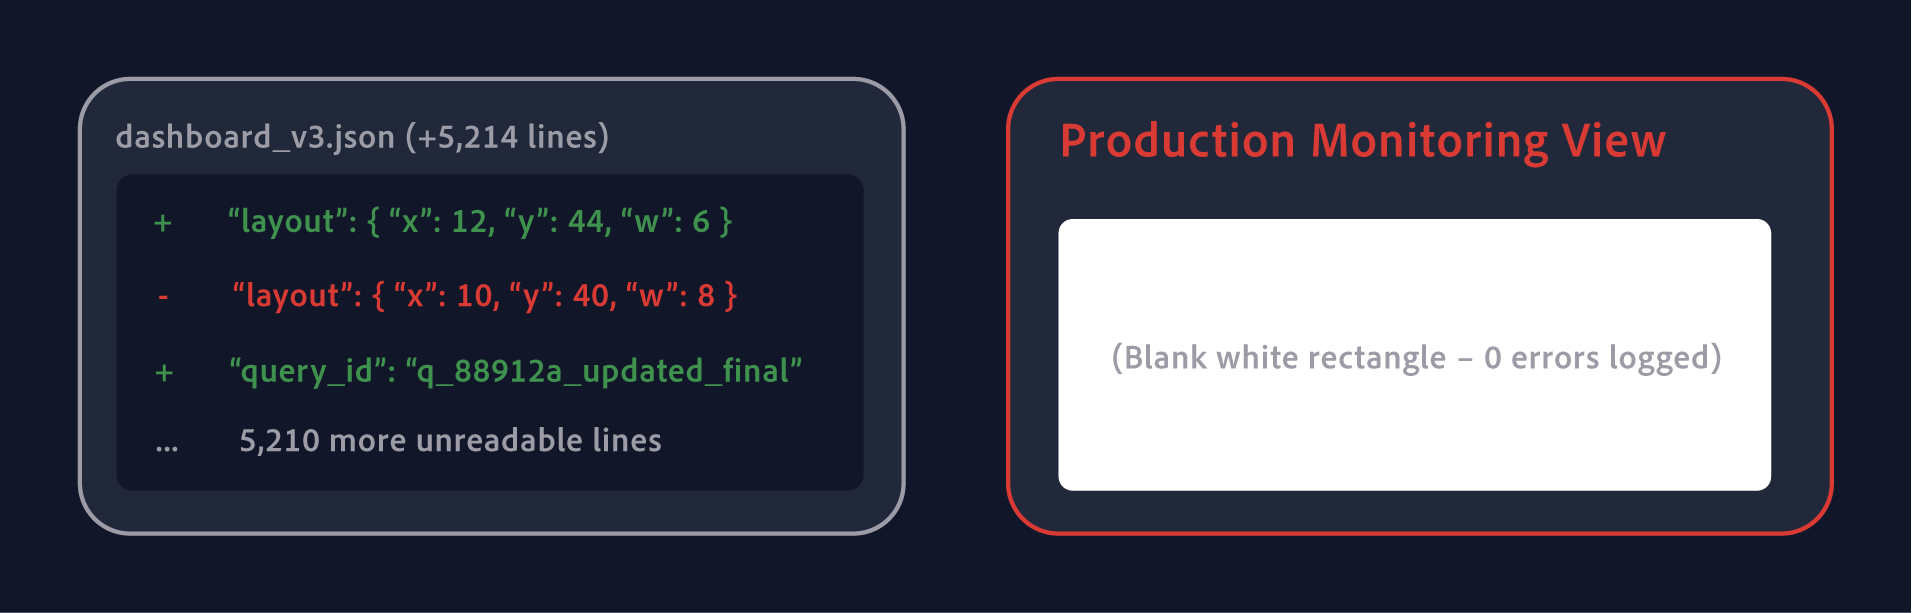
Now they are, and each diff is 5,000 lines of unreadable JSON.
Code review for a bar chart.
No staging environment with realistic, messy data.
Seed data is too clean for this world.
The vendor ships a breaking SDK change with 90 days' notice you missed.
The deprecation email went to an alias nobody monitors.
Rate limits, discovered in production.
Errors inside the iframe never reach your monitoring.
A blank white rectangle is your only symptom.
"Is it your dashboard or my data?" is your new job title.
On-call rotation. For reporting.
The Business of It
Hidden costs of maintaining a portal never seem to make it into the opportunity cost calculation.
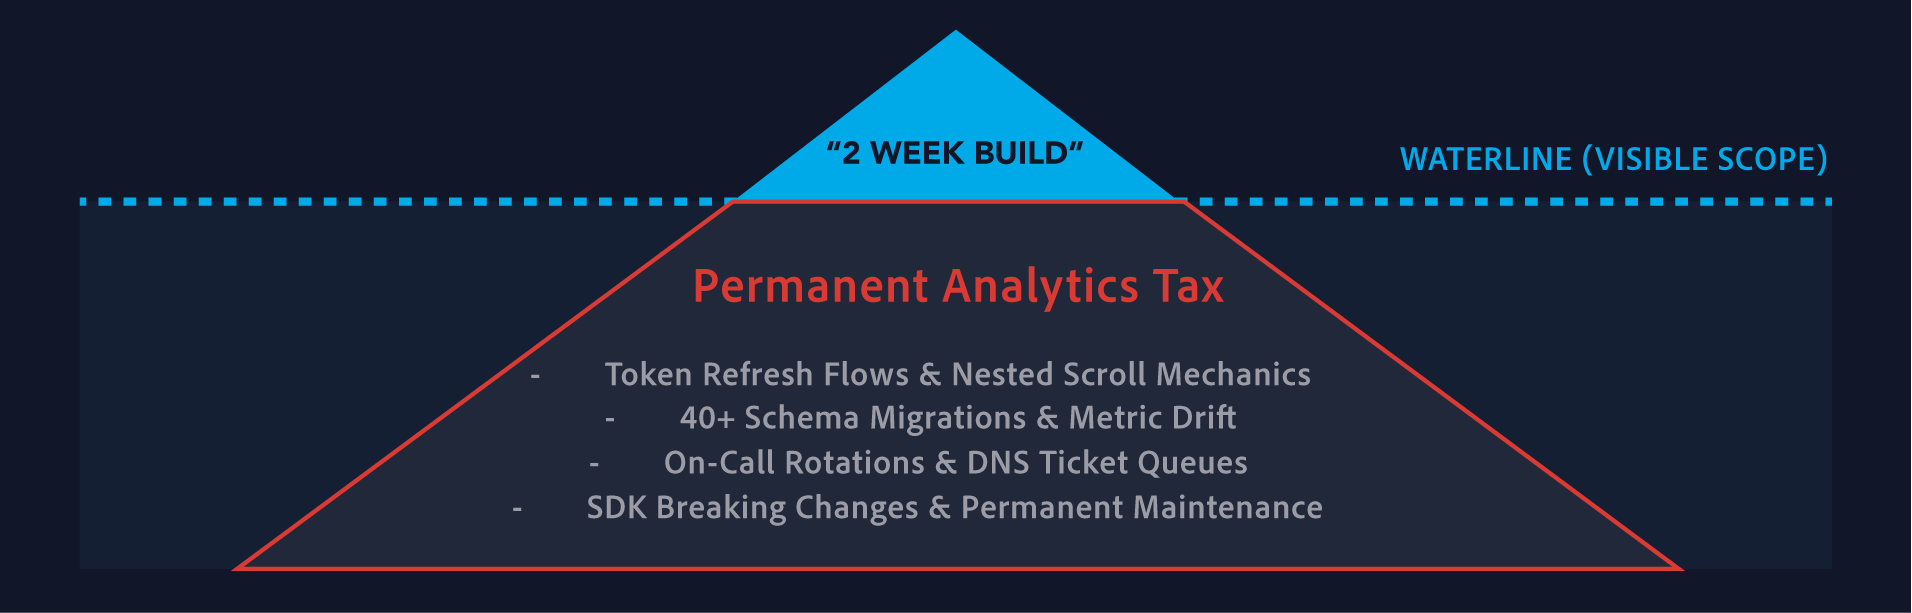
Build-vs-buy math counted the build and ignored years of maintenance cost. The spreadsheet said six weeks of engineering versus a subscription, and six weeks won. What it left out: token refresh, the scroll fix, forty schema migrations, the DNS tickets, the test harness, the on-call rotation, and the engineering hours every quarter spent keeping it all standing while browsers, vendors, and customers change underneath it. The build is a one-time cost. The maintenance is a salary. Run the math over three years instead of one sprint and the answer usually flips. We've watched it flip for a lot of teams.
The one engineer who understood the embed layer quit.
The documentation is a Post-it on a monitor.
Your roadmap now carries a permanent analytics tax.
Every deal adds one small reporting requirement.
Six weeks estimated, two quarters elapsed, still "almost done."
Meanwhile, the feature that actually differentiates your product waits.
You need usage analytics for your analytics.
Pricing: bundled, upsold, or free forever because Sales promised it.
An enterprise prospect asks for a 99.9% SLA on something you built during a hackathon.
Your customers export it all to Excel anyway.
You've become a BI shop, not a SaaS company.
You haven't shipped a core feature in three sprints.
The iframe is the only thing standing between you and lunch.
Your competitor bought theirs and shipped six features while you fixed iframe padding.
Someone on the board asks, "Can we just add AI to the dashboards?"
Yes, We See the Irony
Let MyReportPortal do the heavy lifting
A company that sells embedded analytics just gave you 99 reasons embedding is hard. That's the point. We've built hundreds of embedded dashboards, hit every item on this list, and packaged the fixes into MyReportPortal so you never have to.
You start with one problem: customers want dashboards. Now you have 99 problems.
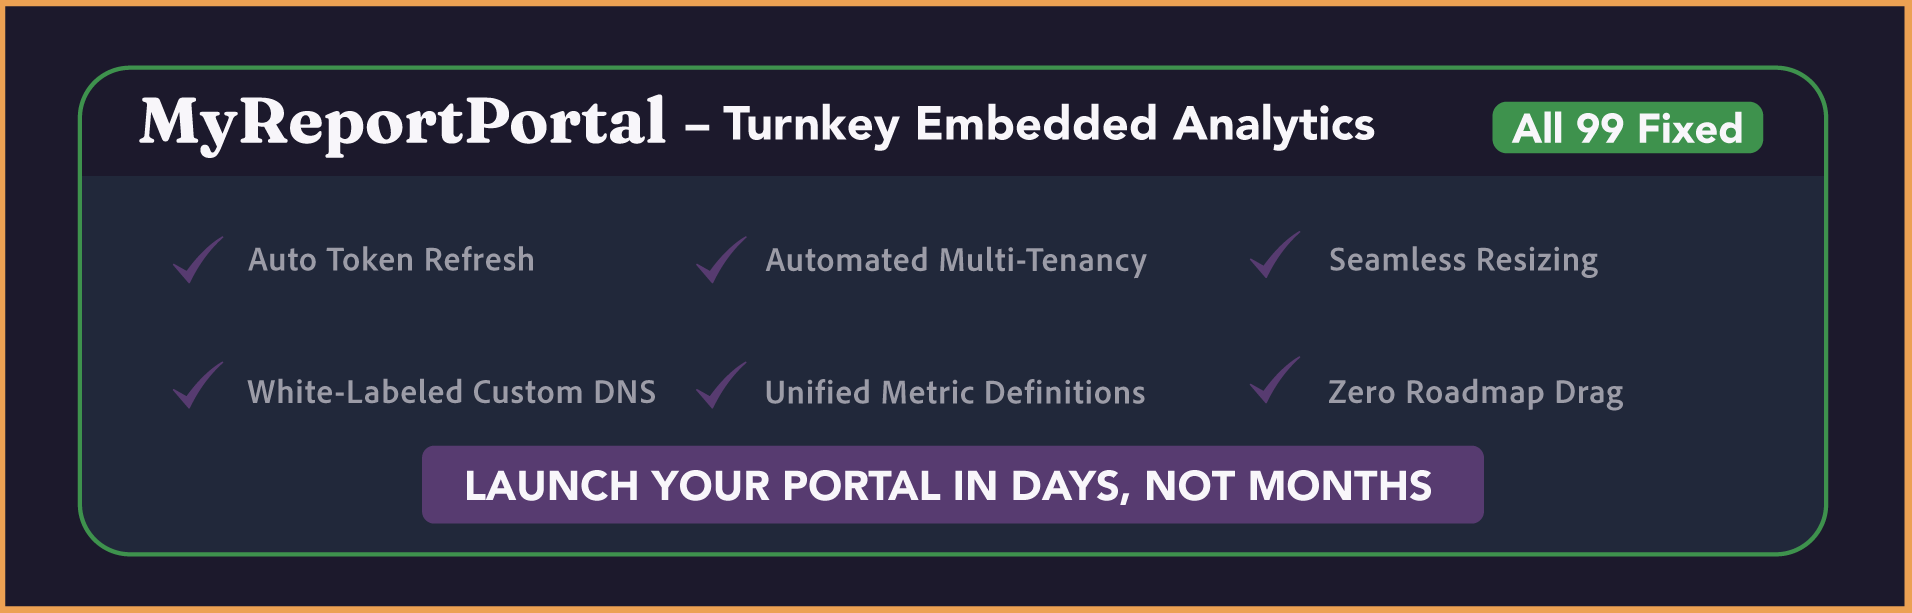
MyReportPortal is a turnkey, no-code, white-labeled portal built specifically for Sigma embedding, with the API integration, user management, and security handled. You keep your roadmap. We keep the 99 problems. Honestly, we've grown attached to them.